API Usage
The Bouncify API Usage page provides a detailed and interactive overview of your API consumption, helping you monitor your usage, analyze trends, and manage your API keys effectively. This guide will walk you through the key features of this page.
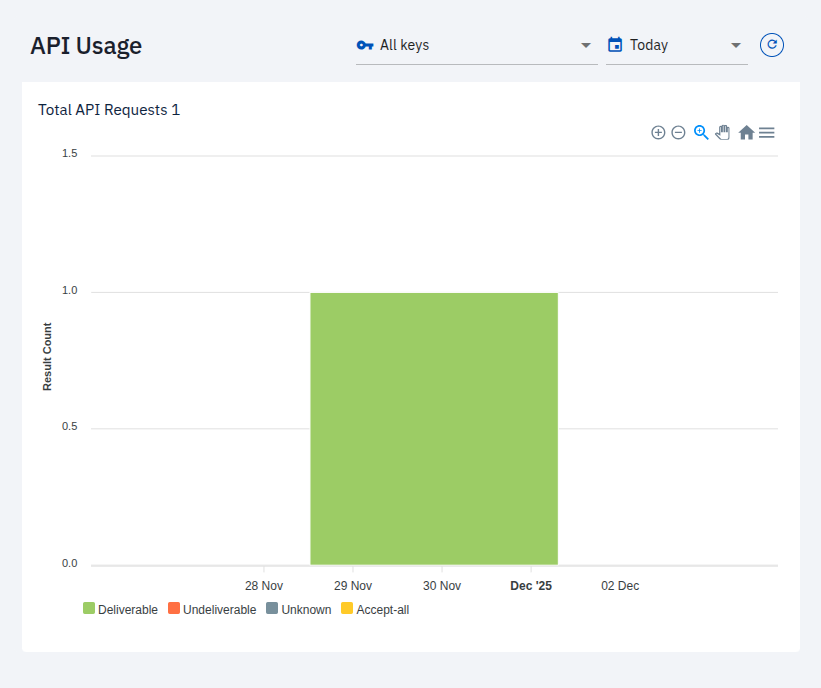
API Usage Chart
The central feature of the API Usage page is the interactive chart that visualizes your total API requests over a selected period. This allows you to quickly understand your usage patterns and identify trends.
The chart displays the number of API requests, categorized by their results:
- Deliverable: The email address is valid and can receive emails.
- Undeliverable: The email address is invalid and cannot receive emails.
- Unknown: The email address could not be definitively verified.
- Accept-all: The email server is configured to accept all emails, so the validity cannot be guaranteed.
Filtering Options
You can refine the data displayed on the chart using the available filters.
Filter by API Key
You can filter the usage data by a specific API key. This is useful for monitoring the activity of individual applications or services.

- All keys: Displays the aggregated usage for all your API keys.
- [Your API Key Name]: Select a specific API key (e.g.,
single_verification) to view its usage in isolation.
Filter by Time Period
The time filter allows you to view API usage over a specific date range.
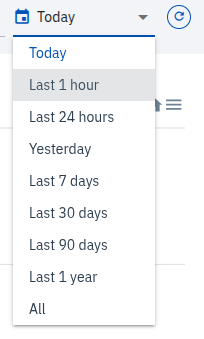
You can select from a range of predefined time periods, including:
- Today
- Last 1 hour
- Last 24 hours
- Yesterday
- Last 7 days
- Last 30 days
- Last 90 days
- Last 1 year
- All
By using these filters, you can gain granular insights into your API consumption and effectively manage your Bouncify account.